
Figure 1.
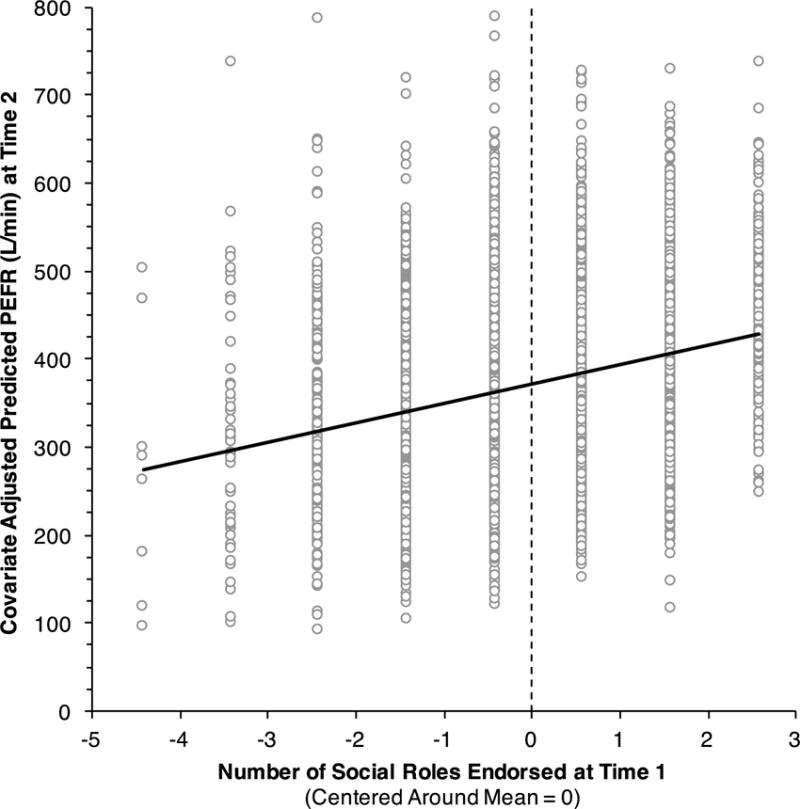
Regression results predicting Time 2 PEFR values (L/min) from total social roles at Time 1, adjusting for individual differences in Time 1 PEFR, age, gender, ethnicity, education, height, and weight (N = 4028). The total number of social roles variable was centered around a mean of 0. The total number of social roles at Time 1 was positively and linearly associated with PEFR at Time 2, β = 0.050, b = 5.144, p < .001, CI95 = [3.187, 7.101].