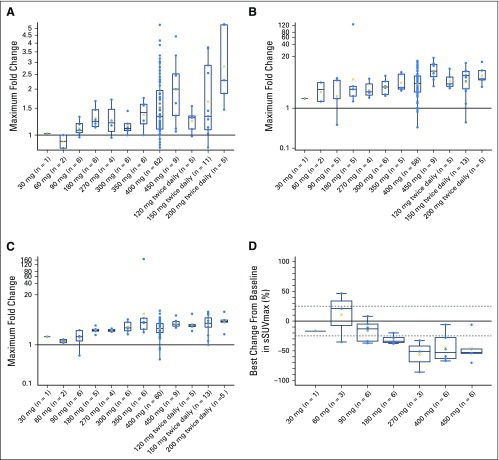
Fig 2.
Maximum fold increase from baseline in (A) fasting plasma glucose, (B) fasting serum insulin, and (C) fasting serum C-peptide during cycle 1, and (D) best percentage change from baseline in sum of maximum standardized uptake values (sSUVmax) measured by [18F]-fluorodeoxyglucose positron emission tomography. X represents the geometric mean value.

