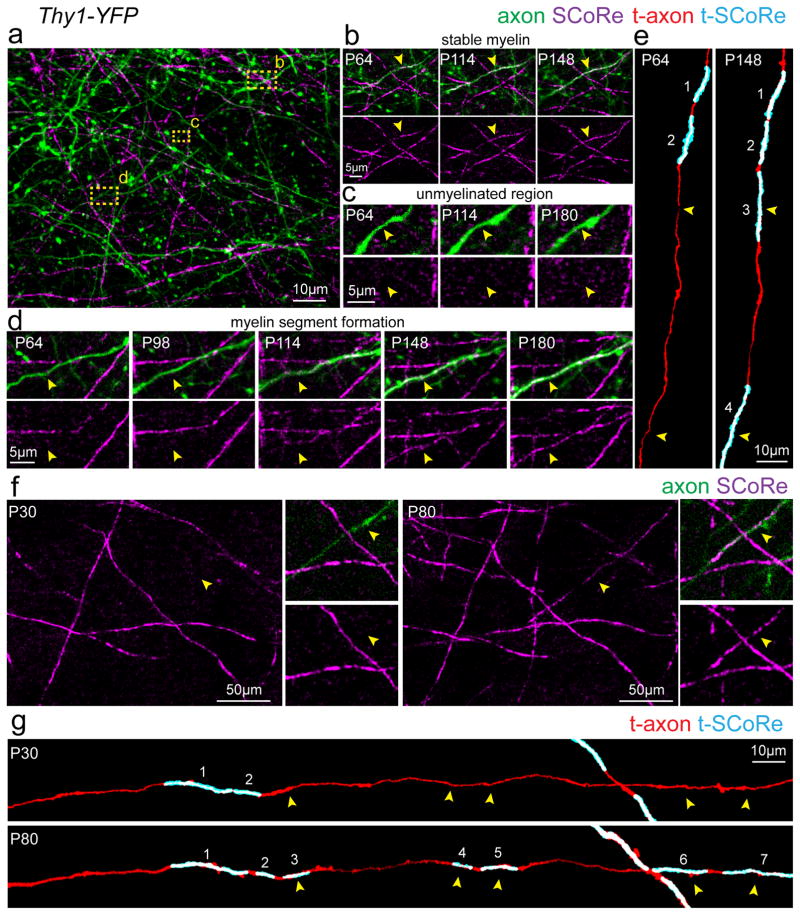
Figure 6. Continuous myelin deposition along partially myelinated axons.
(a) In vivo SCoRe and fluorescence image captured from the cortex of a P64 Thy1-YFP transgenic mouse showing the patchy myelin distribution along a single axon designating the regions highlighted in panels (b–d). (b) Repeated imaging of the region designated in panel (a) showing stable myelination (arrowheads) on this portion of the imaged axon over 84 days of imaging. (c) Repeated imaging of the region designated in panel (a) showing a region along the same axon that remains unmyelinated (arrowheads) over the 116 days of imaging. (d) Repeated imaging of the region designated in panel (a) showing a region along the same axon that becomes myelinated (arrowheads) during the 116 days of imaging. (e) Semi-automatic axonal myelin distribution reconstructions of the axon depicted in (a–d) showing the addition of new myelin segments (arrowheads). Numbers indicate the same myelin segment. (f) In vivo SCoRe and fluorescence time-lapse images showing the formation of a new myelin segment along a single Thy1-YFP fluorescently labeled axon (arrowheads). (g) Semi-automatic axonal myelin distribution reconstruction of the axon designated in (f) showing the formation of several myelin segments along the traced axon (arrowheads) with other regions remaining unmyelinated over the 50 days of imaging. Numbers indicate the same myelin segment. Each image is representative of at least three locations in at least three animals.

