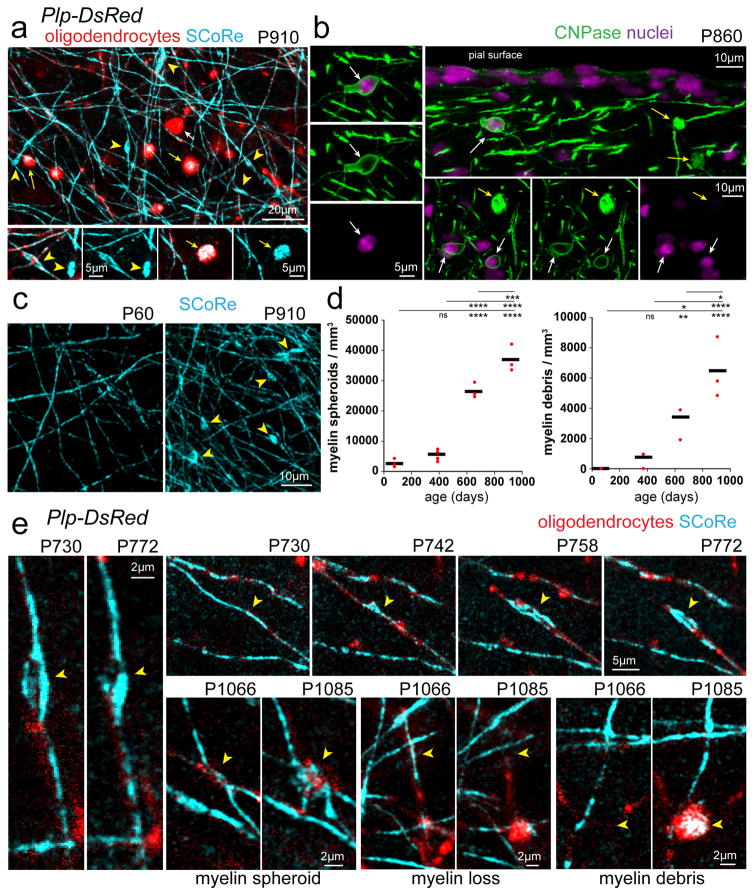
Figure 7. Oligodendrocyte and myelin degeneration in advanced aging.
(a) In vivo images captured from the cortex of a 910-day old mouse with mature oligodendrocytes labeled with DsRed (Plp-DsRed). Examples of myelin pathology detected in aged mice revealed by SCoRe label free imaging and DsRed fluorescence in or derived from oligodendrocytes. Myelin spheroids (yellow arrowheads) can be detected using SCoRe and are only found in aged mice. Myelin debris (yellow arrows) can also be detected using SCoRe and the vast majority were found to have accumulation of DsRed fluorescent protein in the Plp-DsRed transgenic mice suggesting a myelin origin. Myelin debris (yellow arrows) and oligodendrocyte cell bodies (white arrows) can be distinguished due to the lack of SCoRe signals in addition to the proximal processes extending from the cell soma. (b) Images captured from tissue sections immunostained for oligodendrocyte specific CNPase showing the distinction between myelin debris (yellow arrows) and oligodendrocyte cell bodies (white arrows) confirmed via nuclear dye labeling. (c–d) Age-dependent increase in the presence of myelin spheroids (yellow arrowheads) and myelin accumulations, statistical tests: one-way ANOVA with Tukey correction for multiple comparisons n=3–4 mice per age. NS = not significant, * = P<0.05, ** = P<0.01, ***P<0.001, ****P<0.0001. Each dot indicates one mouse and horizontal lines indicate the mean (e) In vivo time lapse images showing the dynamics of age-related myelin pathology (yellow arrowheads) with some myelin spheroids remaining stable, formation of myelin spheroids, single fiber loss, and myelin debris accumulations. Descriptive statistics can be found in Supplementary Table 1. Each image is representative of at least three locations in at least three animals.

