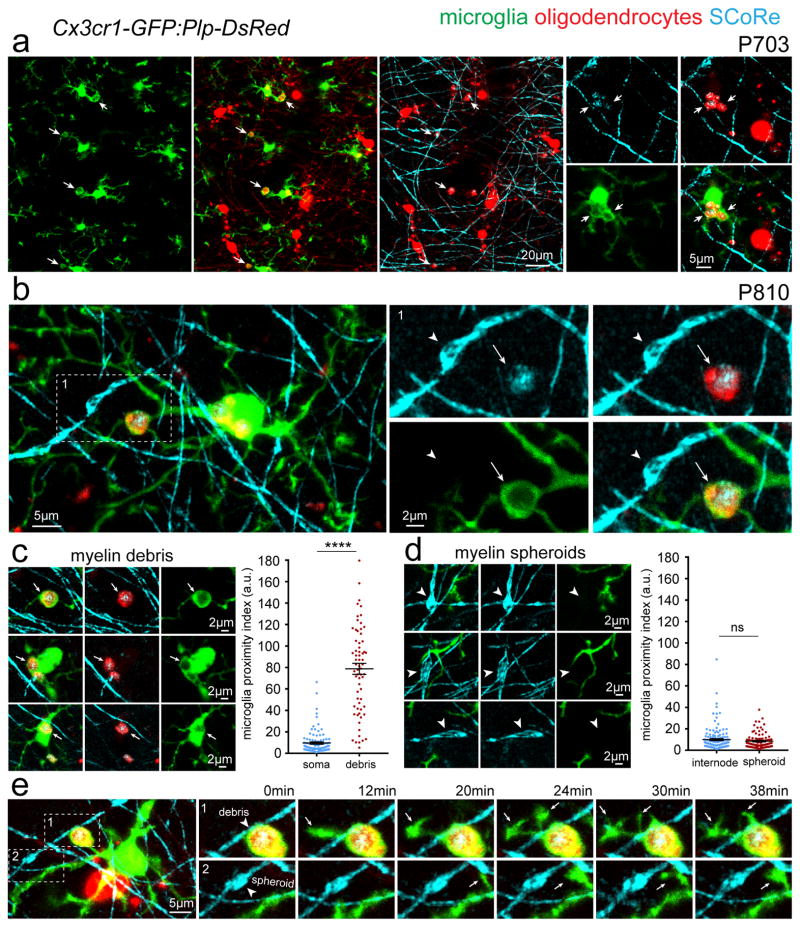
Figure 8. Myelin debris accumulate in microglia in advanced aging.
(a) In vivo combined SCoRe and fluorescence images from aged (P703) dual reporter transgenic mice with GFP-labeled microglia and DsRed-labeled oligodendrocytes (Cx3cr1-GFP:Plp-DsRed) arrows indicate myelin debris accumulations within microglia (b) In vivo image showing accumulation of reflective and DsRed labeled myelin debris within a single microglial process (arrow) but not microglial contact to the immediately adjacent myelin spheroid (arrowhead). (c) Examples images of myelin debris accumulations in GFP labeled microglia (arrows) and quantification of microglia-GFP fluorescence intensity (microglia proximity index) surrounding myelin debris which was not found around intact oligodendrocyte soma (**** P < 0.0001 n = 67 myelin debris structures and 102 oligodendrocyte soma from 3 mice aged P810, unpaired two-tailed student’s t-test) each dot indicates one debris or one oligodendrocyte soma and error bars are mean +/− s.e.m. (d) Example images of myelin spheroids (arrowheads) with no microglia process polarization, association, or engulfment with quantification showing no difference in microglia-GFP fluorescence intensity (microglia proximity index) surrounding myelin spheroids or normal appearing myelin internodes (NS = not significant P = 0.2482, n = 103 myelin spheroids and 136 internodes from 3 mice, unpaired two-tailed student’s t-test) each dot indicates one spheroid or internode and error bars are mean +/− s.e.m. (e) In vivo time-lapse images of the boxed regions showing dynamic microglia surveillance with filopodia (arrows) extending from a single process filled with myelin debris (arrowhead in top image sequence) and no directed microglia surveillance of an adjacent myelin spheroid (arrowhead in bottom image sequence). Descriptive statistics can be found in Supplementary Table 1. Each image is representative of at least three locations in at least three animals.

