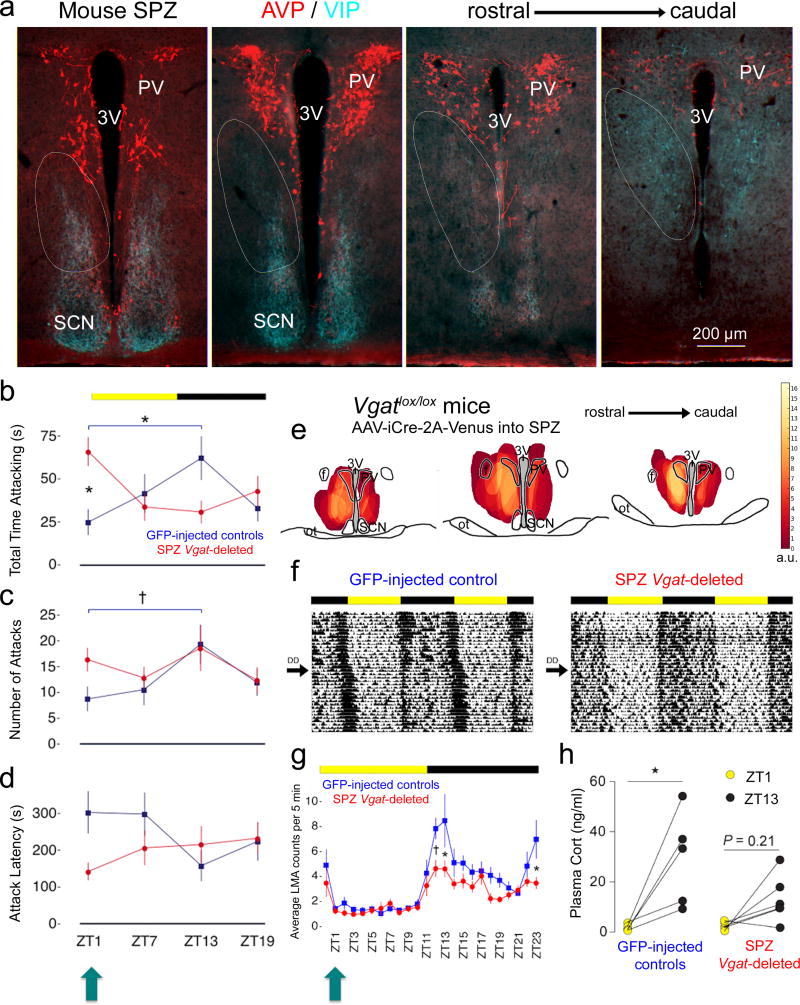
Figure 1. Aggression follows a daily rhythm in mice that is directly regulated by SPZGABA neurons.
(a) Fluorescent immunohistochemistry for VIP (turquoise) and AVP (red) delineating the mouse SPZ (white ovals). Representative of 3 mice. 3V, third ventricle. (b) GFP-injected controls show a rhythm in aggression propensity with highest total time attacking at ZT13 and lowest at ZT1 [blue, n=16, two-way repeated measures ANOVA, interaction: F(3,90)=7.63, P=.0001; post hoc: ZT13 vs ZT1 *P=0.0067]. SPZ Vgat-deleted mice (red, n=16) show a disrupted rhythm with increased total time attacking at ZT1 (post hoc: deleted vs intact *P=0.0055). Means ± s.e.m. (c) A similar rhythm in number of attacks was found in controls [blue, n=12, two-way repeated measures ANOVA, main effect of time: F(3,90)=6.25, P=0.0159; post hoc: ZT1 vs ZT13 †P=0.0244], which was lost in Vgat-deleted mice (red, n=16, post hoc: ZT1 vs ZT13 P=0.99). Means ± s.e.m. (d) Attack latency showed a significant interaction effect [two way repeated measures ANOVA, F(3,90)=4.98, P=0.0362] with a trend towards differences at ZT1 and ZT13 in controls (blue, n=16, post hoc, ZT1 vs ZT13 P=0.0605), and towards decreased latency at ZT1 in Vgat-deleted mice (red, n=16, post hoc: deleted vs intact P=0.0683). Means ± s.e.m. (e) Heat map showing injection sites across Vgat-deleted mice (n=16), each weighted based on magnitude of difference from controls in total time attacking at ZT1. a.u., arbitrary units. ot, optic tract. f, fornix. (f) Double-plotted actograms of entrained (12:12 light-dark cycle, LD), and free-running (constant darkness, DD) LMA rhythms. (g) SPZ Vgat-deleted mice (red, n=8) exhibited decreased LMA during the dark period compared to controls (blue, n=8) [two-way repeated measures ANOVA, main effects of SPZ condition: F(1,14)=11.34, P=0.0046, time: F(23,322)=12.58, P=0.0001, interaction: F(23,322)=1.61, P=0.0393, post hoc: ZT12 †P=0.0204, ZT13 *P=0.0014, ZT23 *P=0.0066]. Importantly, SPZ Vgat-deleted mice did not show increased LMA at ZT1 (turquoise arrow, post hoc: P=0.99). Means ± s.e.m. (h) SPZ Vgat-deleted mice (n=6) also showed lower day-night differences of plasma corticosterone compared to controls (n=5) [two-way repeated measures ANOVA, main effect of time: F(1,9)=18.02, P=0.0022, post hoc: deleted ZT1 vs. ZT13 n.s.P=0.21, intact ZT1 vs. ZT13 *P=0.005]. Means ± s.e.m.

