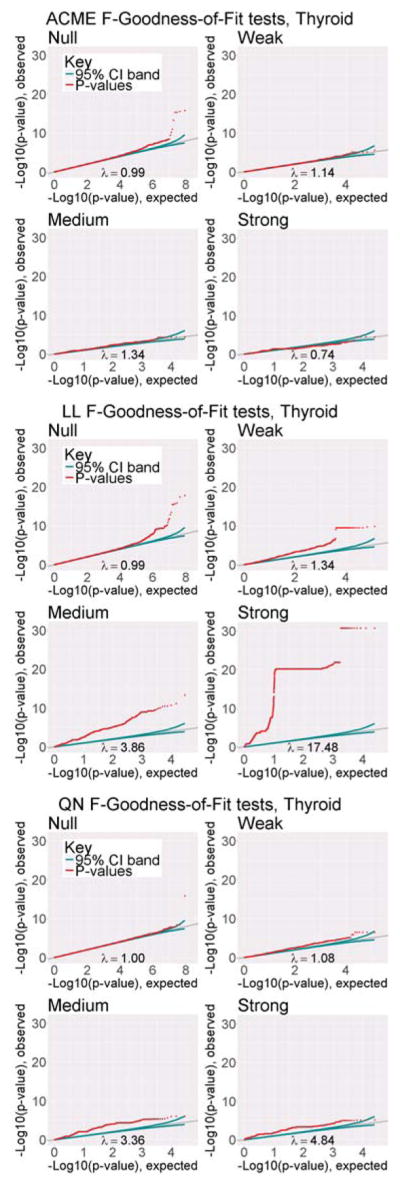
Figure 1.

Q-Q plots of likelihood ratio test p-values for ACME, LL, and QN models, in each sector of GTEx Thyroid sample data, n = 105. The grey line is where we would expect the p-values (represented by the red dots) to fall if they were perfectly uniform, and the green line represents the 95% window of error around this expectation. λ is the estimated genomic inflation factor.
