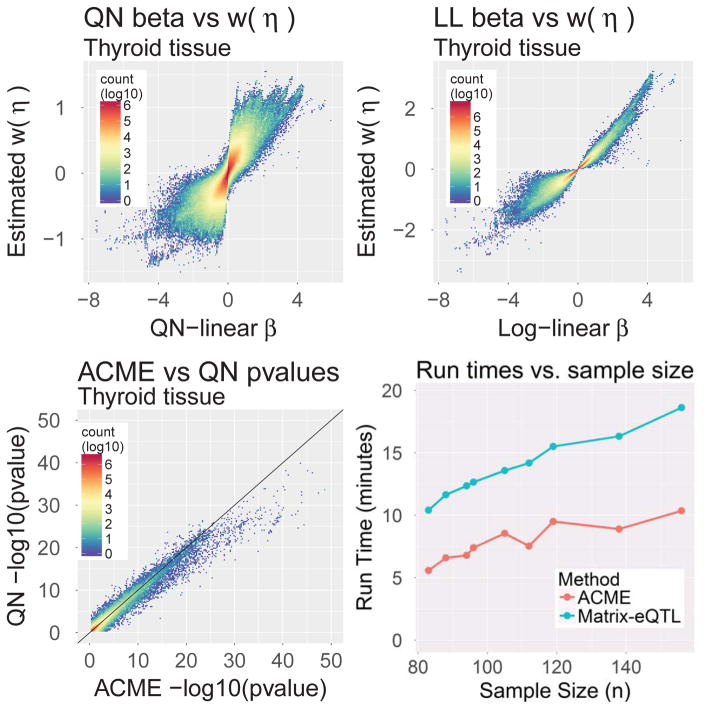
Figure 4.
Results of genome-wide cis-eQTL ACME effect size estimations on Thyroid tissue (n = 105) from GTEx data. Top row: comparisons of ACME effect sizes (transformed with w as introduced in Section 4) with both QN and LL effect sizes. Bottom-left: QN vs ACME regression p-values. Bottom-right: Full-tissue procedure times of the Matrix-EQTL and ACME fitting softwares.

