
Fig. 1.
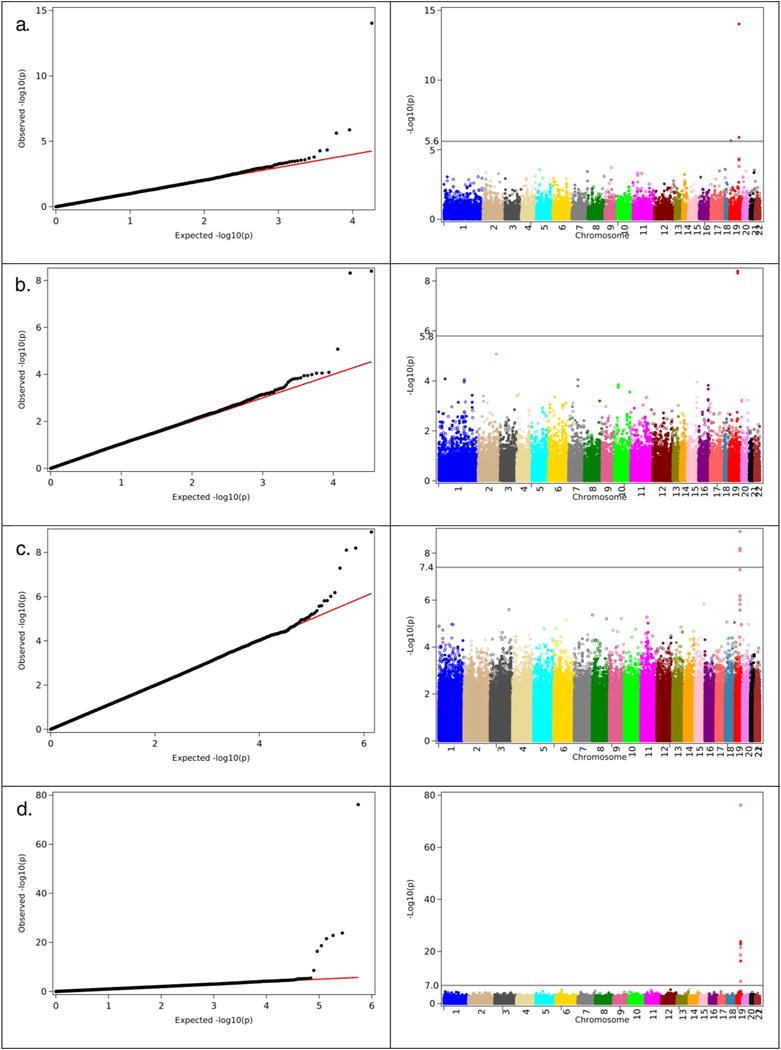
Left panel. The QQ-plots of the results of GWAS of Alzheimer’s disease obtained in the analyses using logistic regression (GLIMMIX in LOADFS) for male and females combined. a). CHS (case: 286; control: 4732); b). FHS (case: 308; control: 3343); c. HRS (case: 656; control: 8768); d). LOADFS (case: 2319; control: 2242). Right panel. Corresponding Manhattan plots for the same analysis as shown on the left panel.