
Fig. 3.
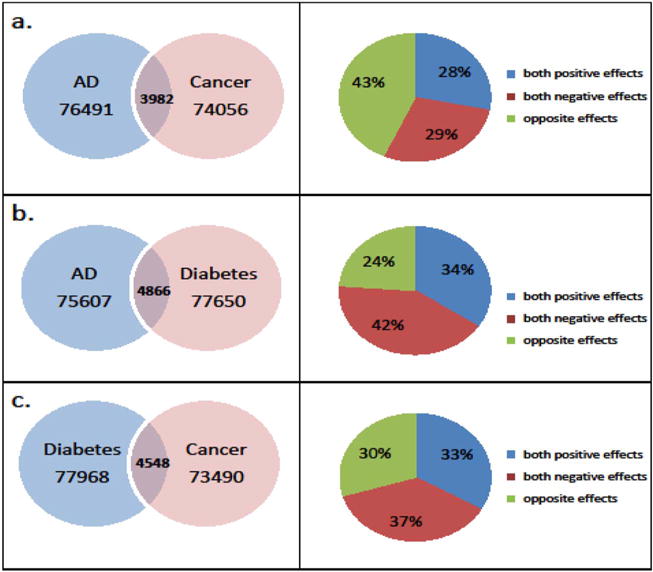
Left panel. The Venn diagrams of intersection of SNPs obtained from GWAS analyses on HRS white individuals using logistic regression: a). between Alzheimer’s/dementia (AD) and cancers (non-skin); b). between Alzheimer’s/dementia (AD) and diabetes; c). between cancers (non-skin) and diabetes. Right panel. Distribution of the overlapped SNPs by the effects corresponding to the left panel.