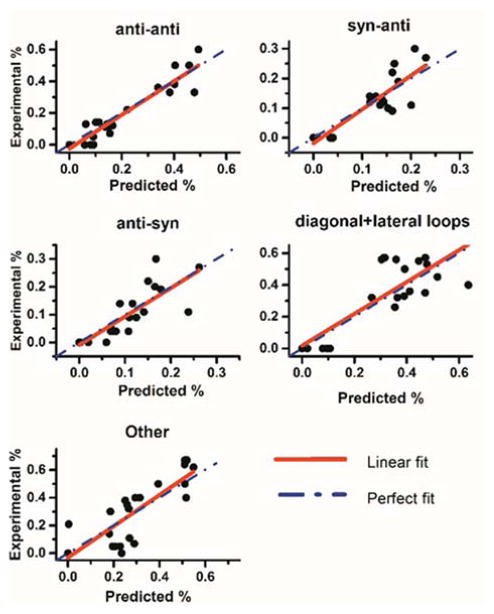
Figure 6.
Scatter plots of the fractions of secondary structural elements determined from the known structures (“Experimental %”) versus the fractions obtained by fits to experimental CD spectra (“Predicted %). These data were obtained using the reference G-quadruplex CD spectra library and a leave-one-out cross-validation constrained least-squares fitting strategy. The red solid line is the least-squares linear fit to the data points, while the dashed blue line represents the line (slope =1) expected for a perfect correlation between the actual and estimated fractions. The correlation coefficients for the linear fits are shown in Table S6.

