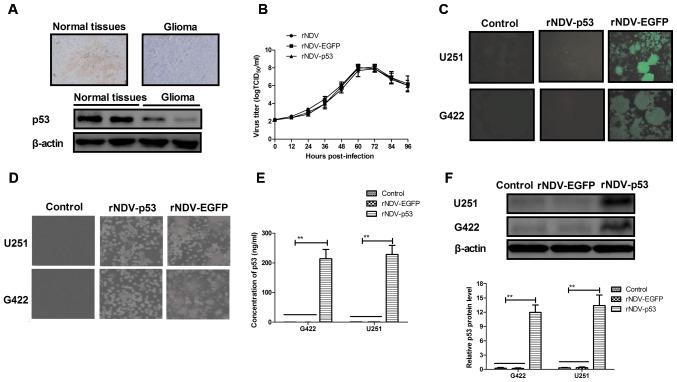
Figure 1.
Characteristics of rNDV and p53 expression in glioma tissues and rNDV-p53-infected cells. (A) p53 expression levels in human glioma tissues and adjacent normal tissue (magnification, ×20). (B) Virus titer of rNDV (control), rNDV-EGFP and rNDV-p53. (C) EGFP expression in rNDV-EGFP and rNDV-p53 infected G422 and U251 cells, as determined using a fluorescent microscope (magnification, ×40). (D) Numbers of rNDV-p53-treated cells in syncytium compared with rNDV-EGFP-treated cells and controls (magnification, ×40). (E) The concentration of p53 expressed in rNDV-p53 and rNDV-EGFP treated G422 and U251 cells using ELISA analysis. (F) Western blot analysis of p53 expressed in rNDV-p53 and rNDV-EGFP treated cells. **P<0.01 vs. control. rNDV, recombinant Newcastle disease virus; EGFP, enhanced green fluorescent protein.

