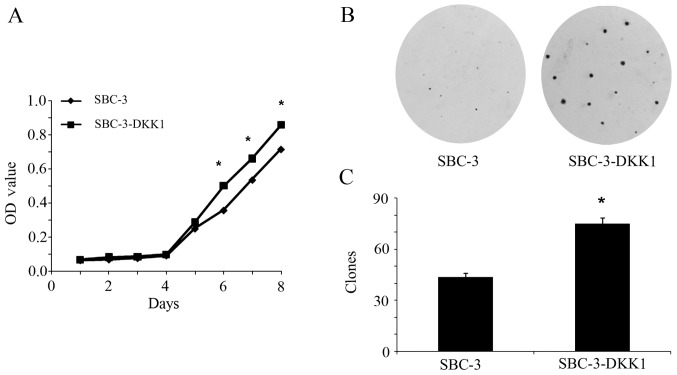
Figure 2.
Effect of DKK1 overexpression on the proliferation and colony formation of SBC-3 cells. (A) Cell proliferation curve as determined by MTT assay. *P<0.05. (B) Representative photographs of SBC-3 and SBC-3-DKK1 cell colony formation. (C) Quantification of the colony formation assay. *P<0.05. DKK1, Dickkopf1; OD, optical density.

