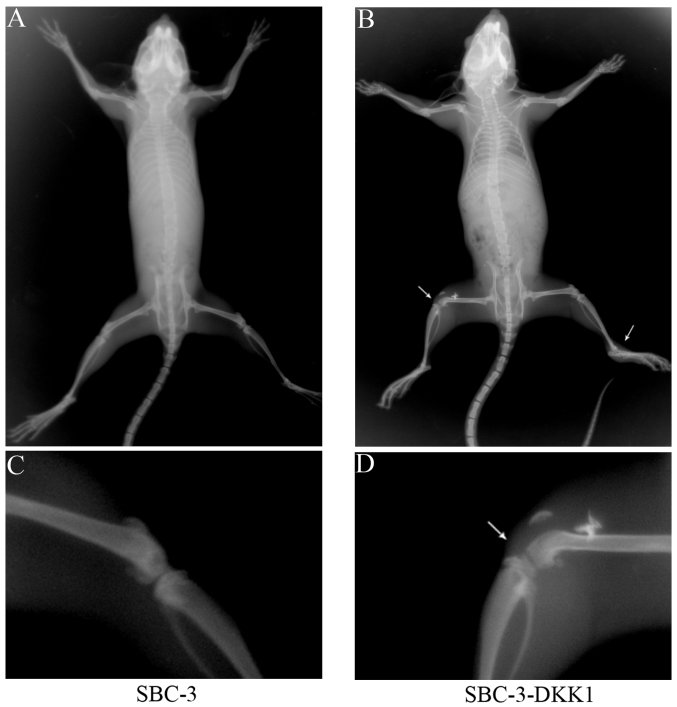
Figure 5.
X-ray images of osteolytic bone metastases in mice. Representative whole body imaging of (A) the SBC-3 group, and (B) the SBC-3-DKK1 group. A higher resolution image of the bone lesions is shown for the SBC-3 and the SBC-3-DKK1 group in (C) and (D), respectively. Metastatic lesions are denoted by arrows. DKK1, Dickkopf1.

