Figure 3.
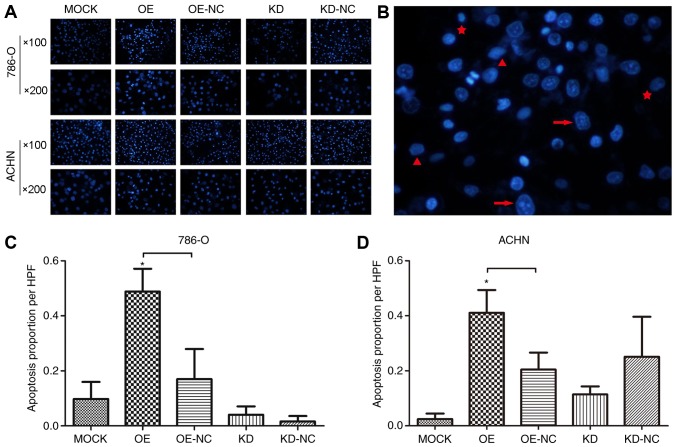
TPM1 overexpression increases renal cell carcinoma apoptosis as detected by DAPI staining. (A) Representative fluorescence microscopy images of DAPI-stained cells at 36 h post-transfection (magnification, ×100 and ×200). (B) Morphological changes of nuclear chromatin at 36 h post-TPM1 overexpression in 786-O cells (magnification, ×200). The red triangle indicates stage I apoptosis characterized by a rippled or creased nucleus. The red star indicates stage IIa apoptosis characterized by a highly condensed or marginalized nucleus. The red arrow indicates stage IIb apoptosis characterized by fragments of splitting nucleus. Apoptotic cell proportions per HPF (magnification, ×200) of the different transfection groups in (C) 786-O and (D) ACHN cells. The values are presented as mean ± standard deviation from five randomly selected HPFs. *P<0.05, with comparisons indicated by brackets. TPM1, tropomyosin-1; OE, TPM1 overexpression; OE-NC, negative control for overexpression vector; KD, TPM1 knockdown; KD-NC, negative control for knockdown vector; HPF, high power field.

