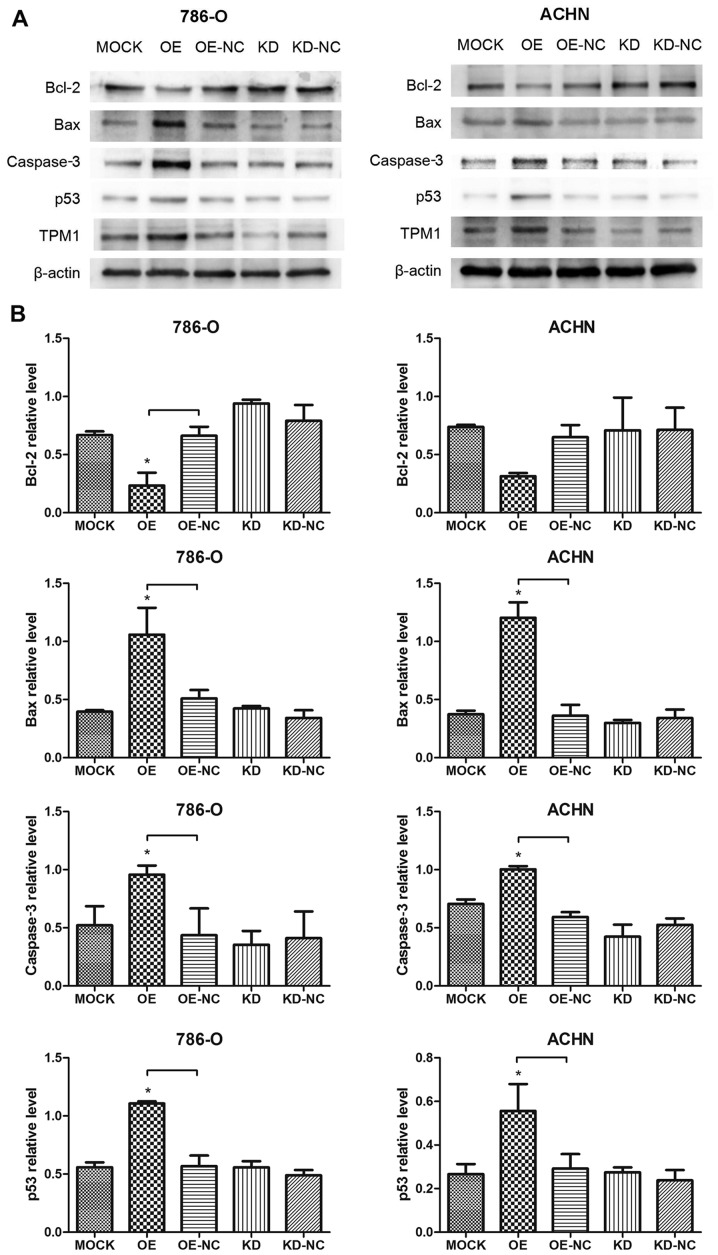
Figure 6.
Effects of TPM1 in apoptosis-related protein expression in renal cell carcinoma cell lines. (A) Representative western blot images of Bcl-2, Bax, caspase-3, p53, TPM1 and β-actin protein expression levels in 786-O and ACHN cells. (B) Quantification of protein expression levels by densitometry in 786-O and ACHN cells. The values are presented as mean ratio ± standard deviation relative to the β-actin value from three independent repeats. *P<0.05, with comparisons indicated by brackets. TPM1, tropomyosin-1; Bcl-2, BCL2 apoptosis regulator; Bax, BCL2 associated X; p53, tumor protein p53; OE, TPM1 overexpression; OE-NC, negative control for overexpression vector; KD, TPM1 knockdown; KD-NC, negative control for knockdown vector.

