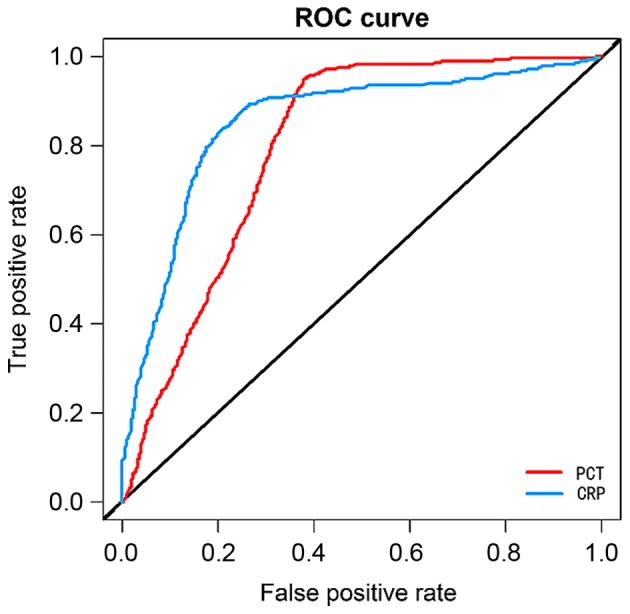
Figure 5.

ROC regression analyses of PCT and CRP. With death as the end of the prognosis of patients, the values of PCT and CRP in predicting the death of patients are relatively great, and their AUC are 0.734 and 0.699, respectively, and 95% CIs are 0.665–0.874 and 0.601–0.792, respectively. ROC, receiver operating characteristic; PCT, procalcitonin; CRP, C-reactive protein; AUC, area under the curve.
