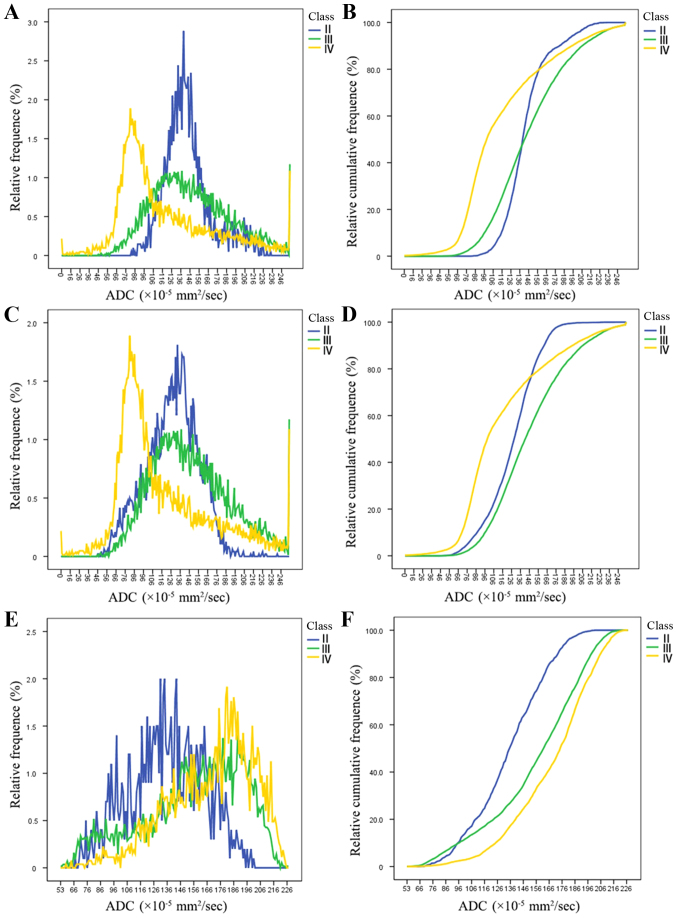
Figure 4.
(A) ADC histograms and (B) its corresponding cumulative histograms of each grade glioma obtained from whole tumor ROI. (C) ADC histograms and (D) its corresponding cumulative histograms for each grade glioma obtained from solid portion ROI. (E) ADC histograms and (F) its corresponding cumulative histograms for each grade glioma obtained from peritumoral edema ROI. ROI, regions of interest; ADC, apparent diffusion coefficient.

