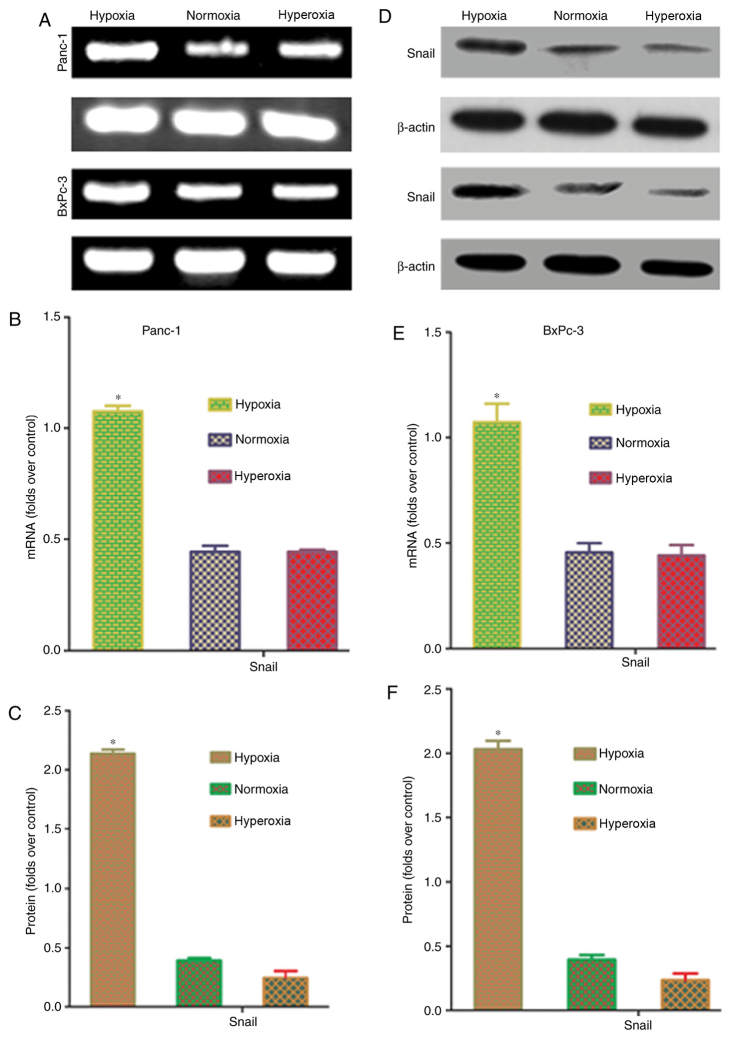
Figure 5.
Effects of different oxygen concentrations on Snail mRNA and protein expression in pancreatic cancer cells. (A) Polymerase chain reaction results demonstrated that the hypoxia group had a significantly higher level of Snail mRNA than the normoxia and hyperoxia groups. (B) Results of statistical analysis of Snail mRNA in Panc-1 cells. (C) Results of statistical analysis of Snail protein in Panc-1 cells. (D) Western blot analysis results indicated that the level of Snail protein expression was significantly upregulated in the hypoxia group, compared with the normoxia and hyperoxia groups. (E) Results of statistical analysis of Snail mRNA in BxPc-3 cells. (F) Results of statistical analysis of Snail protein in BxPc-3 cells. Hypoxia, 5% oxygen; normoxia, 21% oxygen; hyperoxia, 30% oxygen. *P<0.05 vs. normoxia and hyperoxia groups.

