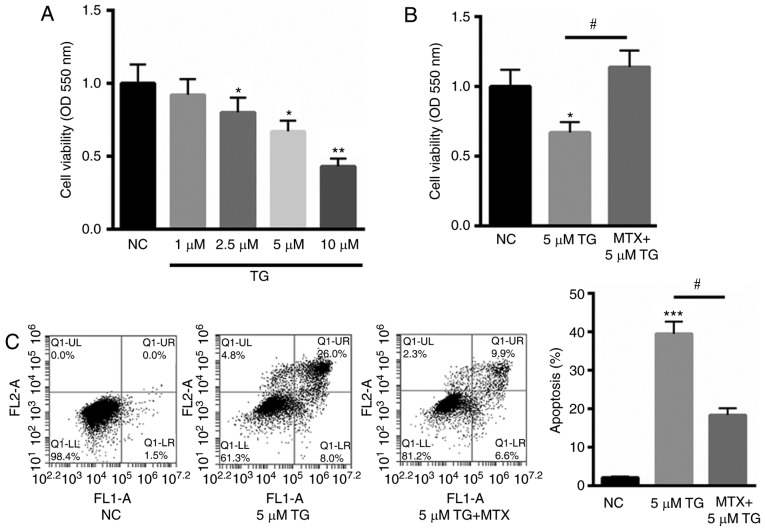
Figure 1.
MTX inhibited TG-induced PC12 cell apoptosis. (A) MTT assay of PC12 cells treated with 1, 2.5, 5, and 10 µM TG. (B) MTX treatment significantly reversed the TG-induced decrease in cell viability by 46.7%. (C) Flow cytometry analysis of PC12 cells treated with 5 µM TG in the presence or absence of MTX. FL1-A on the X-axis represents the relative fluorescence intensity value; FL2-A on the Y-axis represents the relative fluorescence intensity value. Data are presented as the mean ± standard error of the mean. *P<0.05, **P<0.01 and ***P<0.001 vs. NC; #P<0.05. NC, normal control; MTX, methotrexate; TG, triglycerides; OD, optical density.

