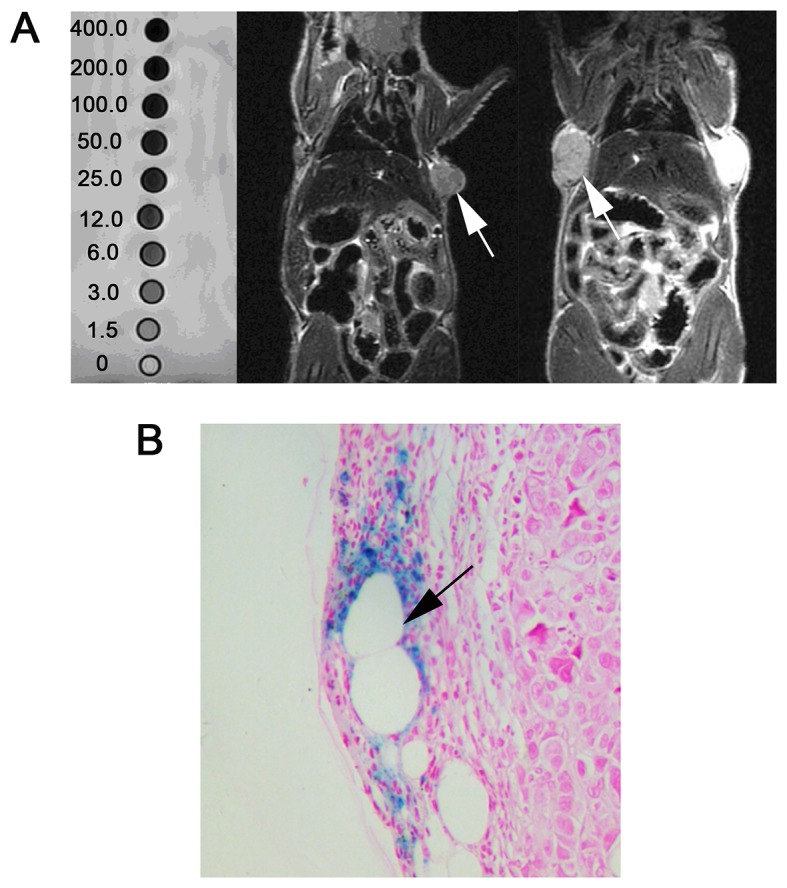
Figure 3.

Biodistribution of NPs. (A) T2-weighted MRI of xenograft tumor mouse model receiving oxaliplatin-Au-Fe3O4-Herceptin NPs. Accumulation of the NPs (low signal) was detected inside the percutaneous tumor mass (left arrow), compared with the group treated with Au-Fe3O4 NPs alone (right arrow) The color spectrum indicated the association between NPs concentration and the color displayed in T2 MRI. (B) Intracellular iron NPs accumulation around the tumor vessel (arrow) were marked blue using Prussian Blue staining (magnification, ×200). NPs, nanoparticles; MRI, magnetic resonance imaging.
