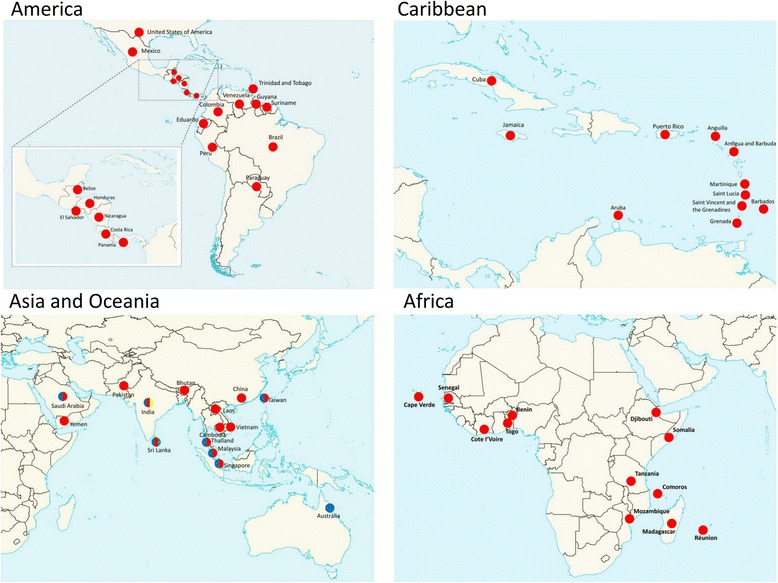
Fig. 2.

Geographical distribution of DENV3/III. The colored circles indicate the isolation of different DENV3/III lineages where green represents DENV3/III-A, red represents DENV3/III-B, blue represents DENV3/III-C, and yellow represents DENV3/III-D. The map was created and modified from Natural Earth, free vector and raster map data @ naturalearthdata.co using QGIS Desktop 2.16.2. The map is licensed under Creative Commons Attribution-ShareAlike 3.0 Licence (CC BY-SA)
