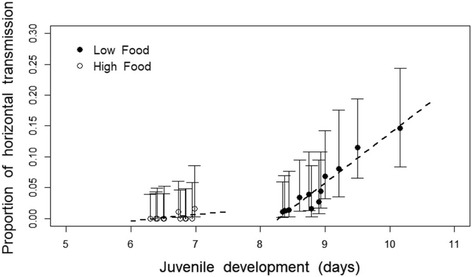
Fig. 3.

Relationship between horizontal transmission and juvenile development. Dots represent the proportion of horizontal transmission per family (proportion of individuals whithin the family enabling horizontal transmission) as a function of the time spent as juvenile at low (closed symbols) and high food (open symbols). The lines represent the regression of the linear model for each food treatment and the bars the±95% confidence intervals
