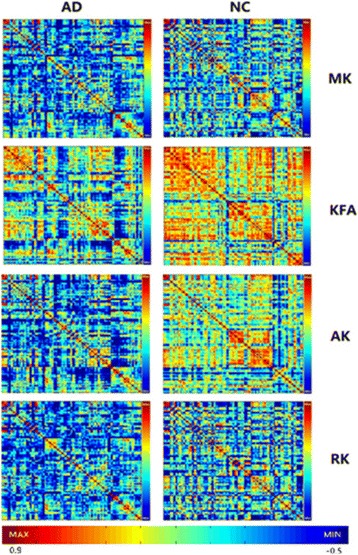
Fig. 1.

The interregional correlation matrix (90 × 90) in the AD and NC groups using DKI metrics of MK, KFA, AK and RK. The color bar indicates the value of the interregional parameter correlation. The red color bar represents the higher positive correlation value. The blue color bar represents the higher negative correlation value. From the maps, a great degree of dispersion in DKI could be observed in AD patients. Note more strong positive coordinated effects existing in extensive brain regions labeled by red color for the metric of MK, KFA, AK and RK in the control group vs. AD group, and KFA is the typical. The higher KFA value meant more compact histological structure
