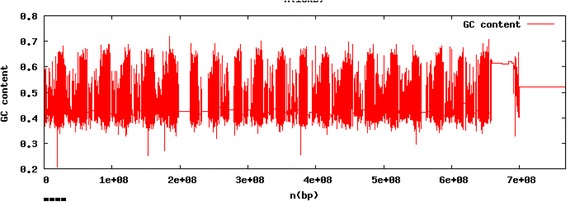
Fig. 1.

Percent GC content of the common loon k = 30 genome assembly. Variation in the percentage of bases composed of paired G (guanine) and C (cytosine) is shown across assembled bases from 1 to 767,326,331 base pairs in the total assembly length. Individual values of GC across the genome assembly were plotted using a sliding window analysis set to examine every 10 Kbp. Regions with no GC content, shown as white spaces, likely represent sequencing gaps
