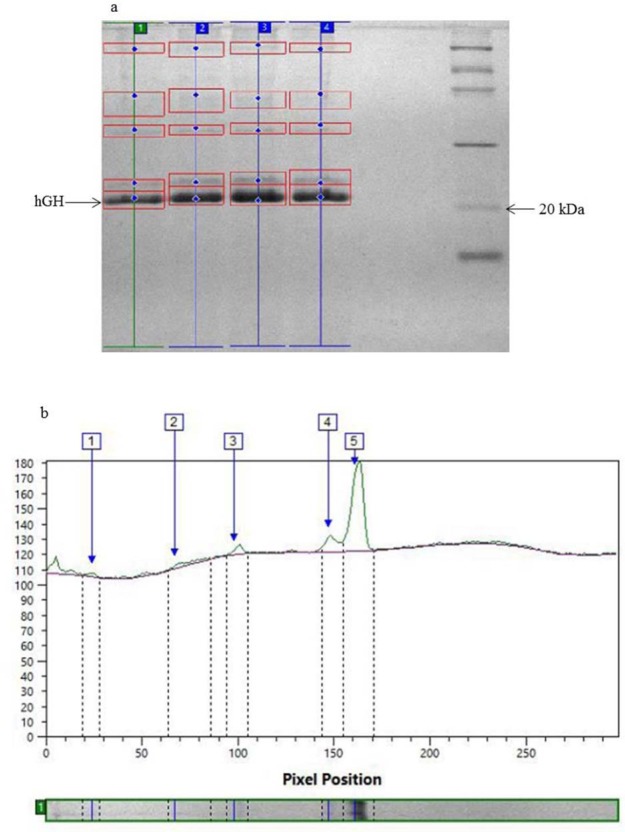
Figure 5.
(a) The effect of various concentrations of ascorbic acid on the level of protein expression, lane 1: methanol/sorbitol mixed-feed strategy, lanes 2, 3, and 4: ascorbic acid 5, 10, and 20 mmol respectively, lane 5: LMW calibration kit for SDS electrophoresis (14.4-97 kDa). (b) Densitometric analysis of fermentation run under optimal condition (lane 3).

