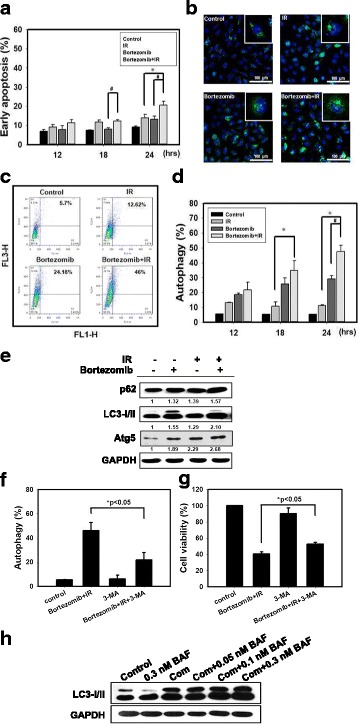
Fig. 2.

Bortezomib and IR induce autophagy in SAS cells. a Measurement of early apoptosis in SAS cells. Early apoptosis detection was measured by flow cytometry with an Annexin V apoptosis detection kit. Cells were treated with 6 Gy of IR or 25 nM of bortezomib for 12, 18, and 24 h. # p < 0.05, bortezomib versus IR + bortezomib. * p < 0.05, IR versus IR + bortezomib. b Confocal immunofluorescence microscopy of LC3 following 24 h treatment with 6 Gy of IR and 25 nM of bortezomib alone or in combination. c Measurement of autophagy in SAS cells. Detection of green and red fluorescence in acridine orange-stained cells using flow cytometry. SAS cells were treated with IR (6 Gy) and bortezomib (25 nM) alone or in combination for 24 h. d Quantification of AVOs with acridine orange using flow cytometry. Cells were treated with 6 Gy of IR or 25 nM of bortezomib alone or in combination for 12, 18 and 24 h. # p < 0.05, bortezomib versus IR + bortezomib. * p < 0.05, IR versus IR + bortezomib. e Western blot analysis of autophagy-related proteins expression in SAS cells. Cells were treated with 6 Gy of IR and 25 nM of bortezomib alone or in combination for 24 h. f Measurement by flow cytometry with AVOs in the absence or presence of 3-methyladenine (3-MA). Cells were pretreated with 3-MA (2 mM) for 1 h before combined treatment (6 Gy of IR and 25 nM of bortezomib) for 24 h. g Cytotoxic effects in the absence or presence of 3-MA for 24 h. h Western blot analysis of LC3 expression in the absence or presence of bafilomycin A1 (BAF). Cells were pretreated with BAF for 1 h before combined treatment (6 Gy of IR and 25 nM of bortezomib) for 24 h. *p < 0.05, IR + bortezomib + 3-MA versus IR + bortezomib
