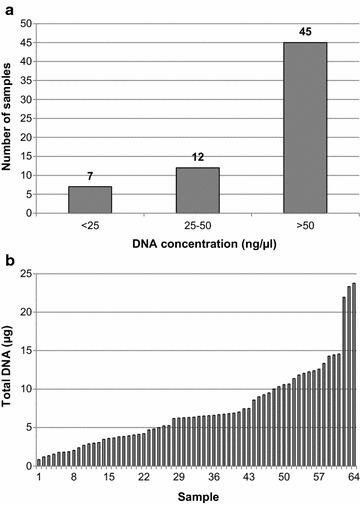
Fig. 3.

Concentration of DNA. DNA concentrations of all 64 samples were determined by fluorometric measurement (Quantus). Samples were assembled into three groups of low (less than 25 ng/µl), medium (between 25 and 50 ng/µl), and high (more than 50 ng/µl) DNA concentrations (a). The total DNA content of each sample was calculated and visualized in a waterfall diagram (b)
