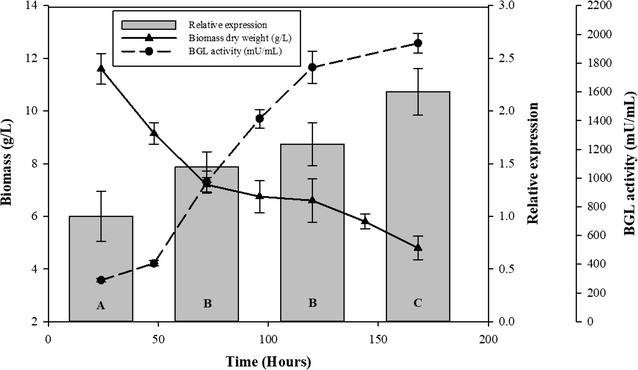
Fig. 4.

Comparison of qRT-PCR analysis of bgl-3 expression and biomass over the time in cultures with Mandels medium supplemented with glucose. Samples were taken periodically to determine β-glucosidase activity against 0.1% pNPG, relative expression by qRT-PCR, and biomass dry weight. Data represent the mean of six replicates. Statistically significant differences between means were determined by the Tukey HSD test. Different letters in qRT-PCR results (A, B, C, and D) indicate significant differences at a P value of 0.05
