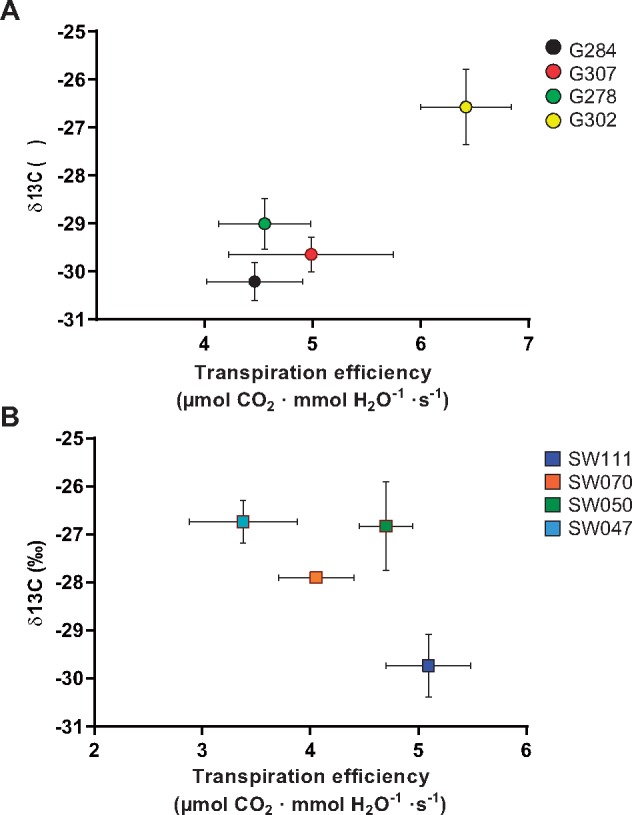
Fig. 5.

Relationship between δ13C and calculated transpiration efficiency. (A) Spring lines show a positive trend between δ13C and transpiration efficiency determined by the ratio of photosynthetic assimilation and transpiration rate (r2 = 0.866). (B) Semi-Winter lines did not show a positive trend.
