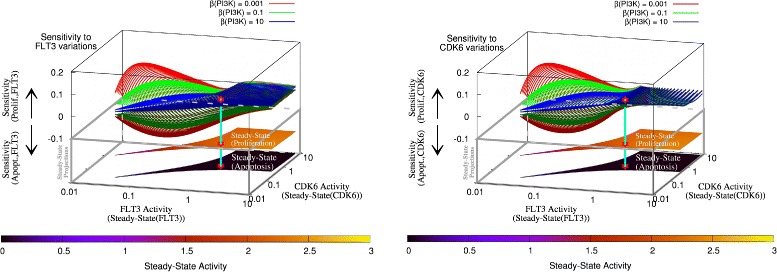
Fig. 2.

Fine-grained simulations. Steady-state and sensitivity of proliferation and apoptosis to variations of the activities of FLT3 and CDK6. Convex (concave) surfaces represent the sensitivity of the proliferation (apoptosis) end-point with respect to variation in FLT3 (left) or CDK6 (right) activities. The bottom projections in the lower planes (within the gray box) are set to arbitrary z-axis values and represent steady-state activities of the end-points as a function of FLT3 and CDK6 activities at low PI3K activity. These projections correspond to the sensitivity surfaces in the upper part and allow to visualise how the variables FLT3 and CDK6 depend on each other, and their influence on the network end-points (further details of such projections at different levels of PI3K activity are available in Additional file 1: Figure S5–S6). The red star symbols indicate the point where sufficient inhibition of FLT3 (10-fold inhibition from the maximum) and CDK6 (15-fold inhibition from the maximum) drive the system to a controllable region of intermediate steady-state levels of both proliferation and apoptosis. A cyan segment connects this point through the different complementary quantities represented, i.e., the sensitivities at different PI3K activities in the upper surfaces, and the corresponding end-points’ steady-state activities in the lower projections. This multidimensional representation allows to appreciate both the steady-state activity of the variables (which would correspond to experimentally measurable quantities such as tumour markers, RNA or proteins), as well as their sensitivity to changes in the other variables’ activities. The left and right plots can be compared to top-view heat maps for proliferation (Additional file 1: Figure S5) and apoptosis (Additional file 1: Figure S6) which represent steady-state and sensitivity. PCA of the network variables under different PI3K independent activities is shown as a function of PI3K activities in Additional file 1: Figures S7–S9
