FIGURE 4:
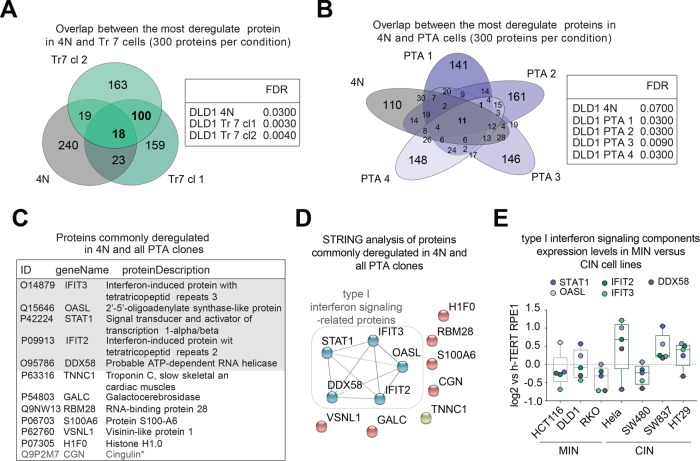
Comparative proteomic analysis of DLD-1–derived cells. (A, B) Left panels: Venn diagrams represent the numbers of shared protein deregulated across the indicated cell lines. Results were obtained by selecting the 300 most deregulated proteins per cell line (based on a false discovery rate [FDR] of <10%). Right panels: tables listing the FDR for each cell line. (C) Listing of the 11 proteins commonly deregulated across tetraploid and PTA clones, as shown in B. Asterisk demarks the single protein found to be deregulated specifically to PTA clones only, as shown in B. Shaded area highlights proteins involved in type I interferon signaling. (D) STRING functional network analysis of the 11 proteins commonly deregulated in 4N and PTA clones, as shown in B and C. Nodal connections are based on a confidence value of 0.9, using experimental and database evidence. (E) Box-whisker plots show the relative abundance of proteins involved in type I interferon signaling across microsatellite instable (MIN) and chromosomally instable (CIN) cell lines. The graph is based on experimental data shown in Supplemental Figure S1, A and B, and Supplemental Table S1. Data in E are from a single biological replicate (pilot experiment).

