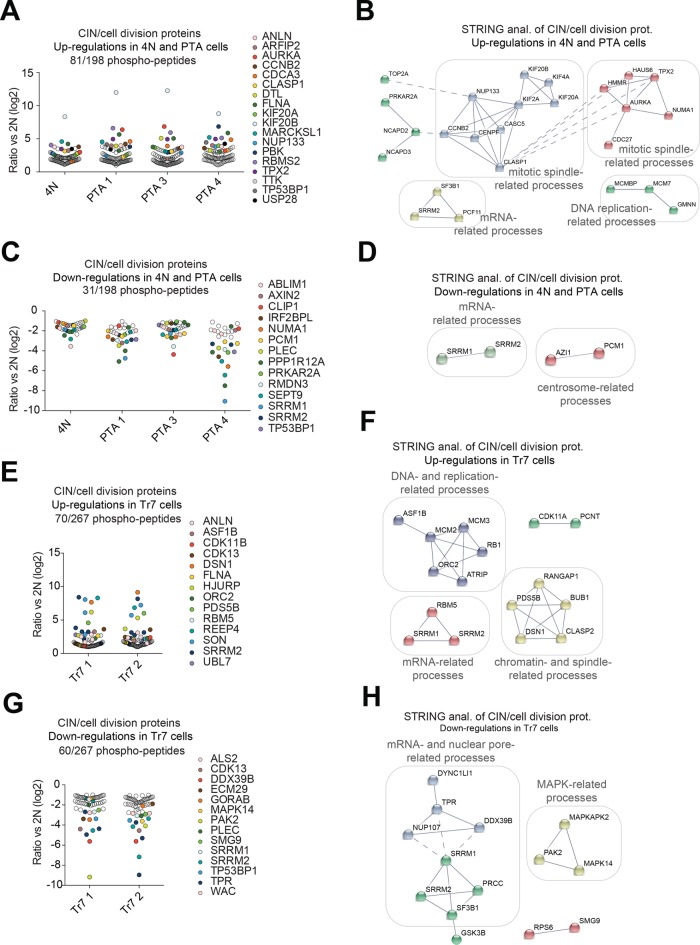
FIGURE 6:
Targeted analysis of protein phosphorylation in DLD-1–derived cells. (A, C, E, G) Dot plots showing the phosphopeptide ratios (versus parental 2N cells) of detected proteins belonging to the CIN/cell division inclusion list and showing at least twofold deregulation. Dots represent significant (p ≤ 0.05) phosphopeptide log2 ratios. Proteins related to mitotic spindle regulation and chromosome segregation are shown in bold. (B, D, F, H) STRING functional network analysis of the data shown in A, C, E, and G. Nodal connections are based on a confidence value of 0.9 using experimental and database evidence. Solid lines indicate intranetwork and dashed lines internetwork connections.

