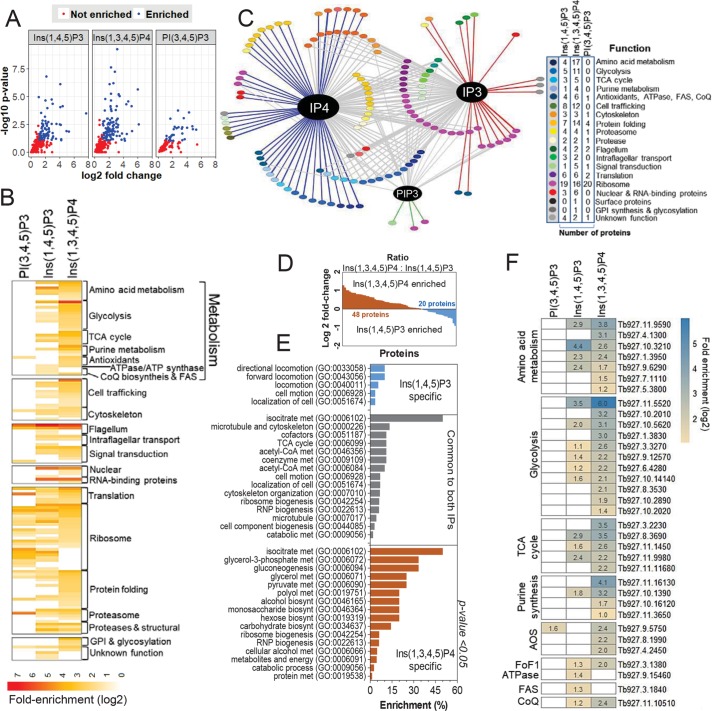
FIGURE 5:
Proteomic analysis of inositol phosphate interacting proteins. (A) Volcano plots indicate proteins that interact with Ins(1,4,5)P3 or Ins(1,3,4,5)P4 compared with nonconjugated beads (enrichment cutoff ≥ 2-fold and p value < 0.1). See Supplemental Dataset S2 for list of proteins. (B) Fold enrichment analysis of proteins that interact with each IP by functional categories. (C) Network analysis of protein IP interactions. Blue line, Ins(1,3,4,5)P4 interactions; red line, Ins(1,3,4)P3 interaction; gray line, proteins that interact with both IPs. (D) Ratio of fold enrichment of proteins identified as interacting with Ins(1,3,4,5)P4 vs. Ins(1,4,5)P3. (E) GO enrichment analysis of proteins interacting with Ins(1,4,5)P3, Ins(1,3,4,5)P4, or both. (F) Heat map of metabolic proteins that interact with each IP (subset indicated by brackets in B). Fold enrichment values are indicated for each protein.

