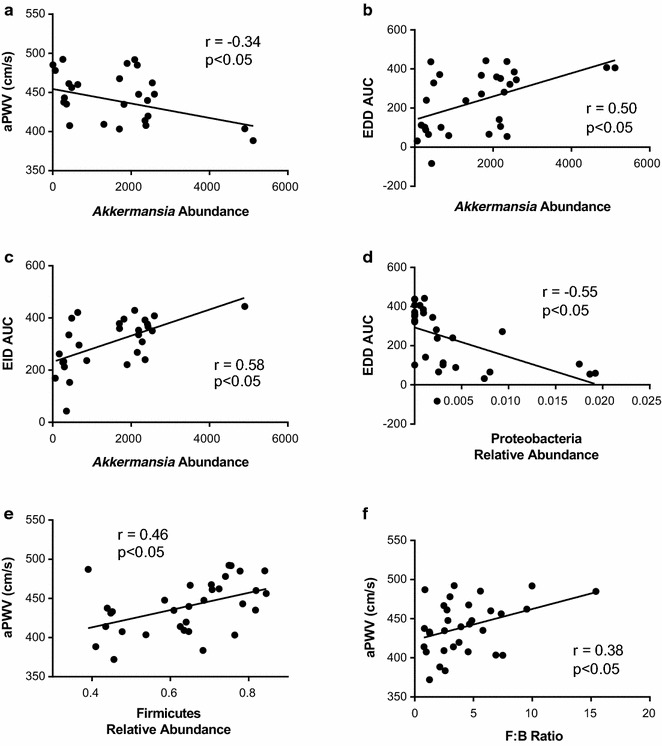
Fig. 8.

Correlations between microbiota and vascular outcomes. a aPWV and Akkermansia abundance; b EDD AUC and Akkermansia abundance; c EID AUC and Akkermansia abundance; d EDD AUC and Proteobacteria relative abundance; e aPWV and Firmicutes relative abundance; f aPWV and F:B ratio. r and p values are given following Pearson’s correlation test. n = 6–10/group
