Fig. 1.

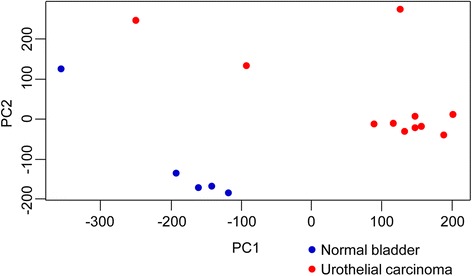
Principal component analysis (PCA) plot of canine iUC and normal bladder. The PCA plot shows clear separation between canine iUC (red) and normal bladder (blue) samples

Principal component analysis (PCA) plot of canine iUC and normal bladder. The PCA plot shows clear separation between canine iUC (red) and normal bladder (blue) samples