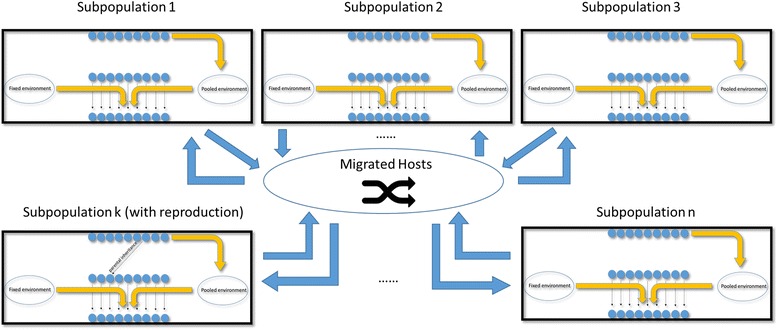
Fig. 2.

Population division and host migrations. Each black rectangle represents one host subpopulation. Each subpopulation undergoes the same process described in Fig. 1b except that only one subpopulation is randomly selected for host reproduction/death event at each time step. Host migration is a shuffling process. At the end of each time step, a percentage (determined by host dispersal rate) of hosts are randomly selected from all host subpopulations for migration. The original slots occupied by these migrating hosts are refilled by them in a shuffled order. If host migration rate is zero, no individuals are exchanged
