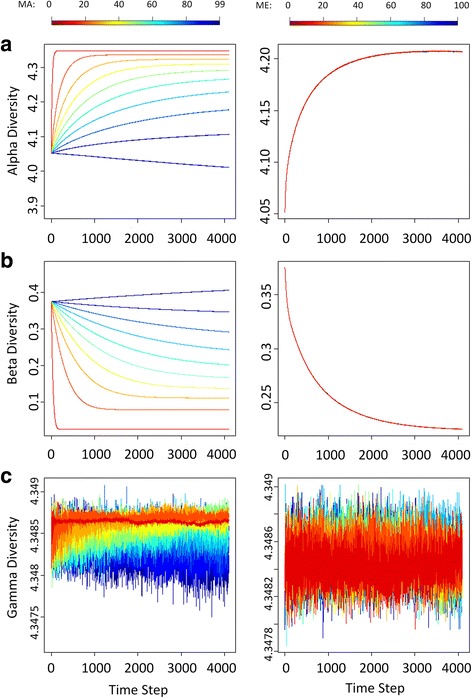
Fig. 3.

Diversity trace plots over time under different MAx and MEy in absence of population division. Each row labeled with (a), (b), or (c) represents one type of diversity (from top to bottom: α-, β-, and γ-diversities). Colors of lines indicate the percentage of parental inheritance (the left column: MAx) or the percentage of pooled environmental contribution (the right column: MEy)
