
Figure 4.
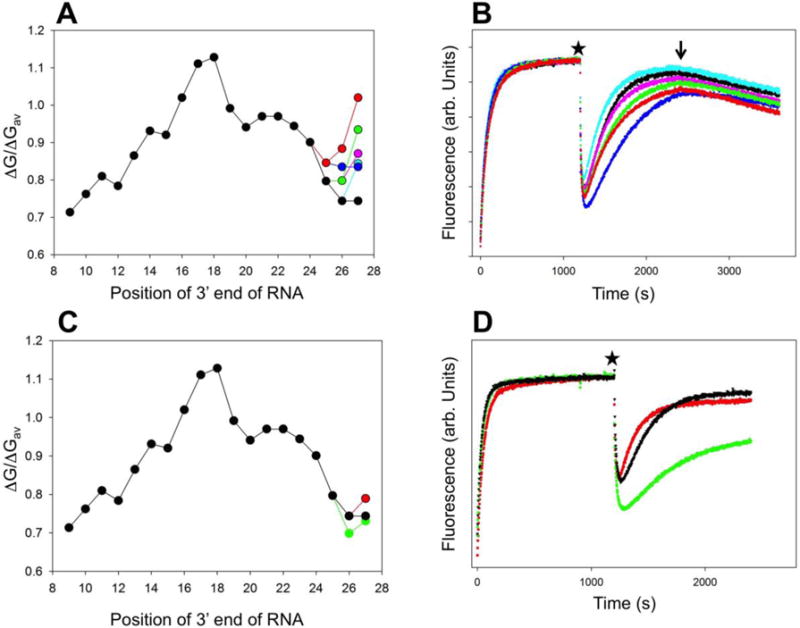
(A) Comparison of calculated relative 9 bp duplex stabilities for P27-31 (cyan), P27-32 (pink), P27-33 (blue), P27-34 (green), and P27-35 (red) constructs with P27 construct (black). (B) Fluorescence intensity changes of constructs from panel A (the color coding is the same as in panel A). At time 0 the promoter was added to a solution of RNAP in a fluorometer cuvette. At the time point marked by a star the transcription was started by adding ATP, UTP, GTP and heparin. The arrow indicates addition of CTP. (C) Comparison of calculated relative 9 bp duplex stabilities for P27-36 (red), P27-37 (green), with P27 construct (black). (D) Fluorescence intensity changes of constructs from panel C (the color coding is the same as in panel D). At time 0 the DNA construct was added to a solution of RNAP in a fluorometer cuvette. At the time point marked by a star the transcription was started by adding ATP, UTP, GTP and heparin.