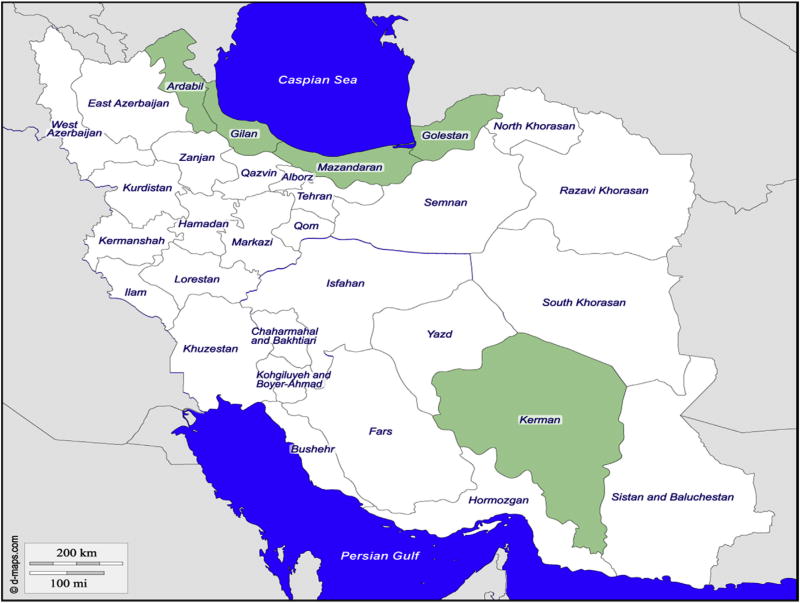
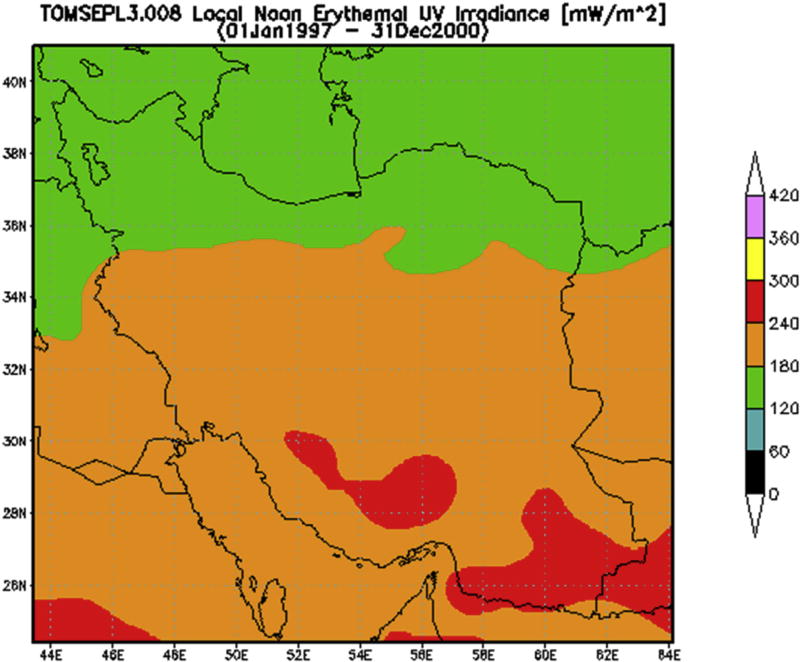
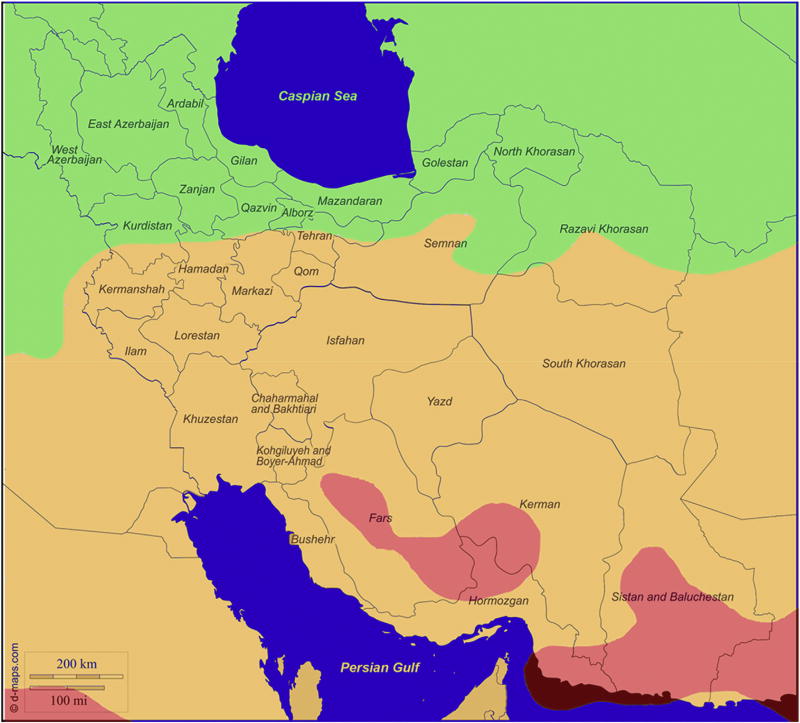
Fig. 1. Map of Iranian Provinces and Ultraviolet Radiation Exposure Patterns.
Panel A. Map of Iran created using d maps.com. The four provinces of Golestan, Mazandaran, Gilan and Ardabil in the north and the province of Kerman in the south east of the country are shown in green.
Panel B. Map of Erythemally-weighted average solar UV radiation (UVR) exposure values for Iranian provinces. Erythemally-weighted solar UV (with contributions from both UVB and UVA) was measured using data from National Aeronautics and Space Administration (NASA) Total Ozone Mapping Spectrometer (TOMS) (NASA; NASA, 2005). The color-coded scale on the right depicts the value of UV irradiance in mW/m2 for each province, showing a general increase in UVR exposure values from north to the south of the country.
Panel C. Panel B (Erythemally-weighted average Solar UV irradiance values depicted by color codes) superimposed on Panel A (geographic map of Iran).


