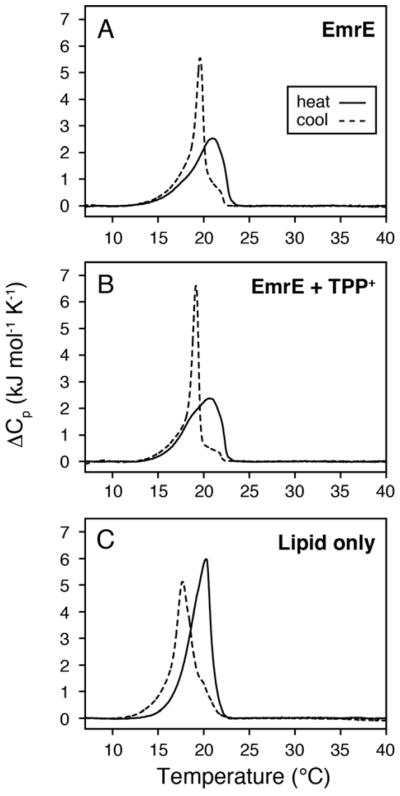
Figure 3.

DSC thermogram data for 3/1 POPE/POPG bilayers in the presence of protonated-EmrE (A), TPP+-bound EmrE (B), and lipid only (C). The samples containing EmrE used a lipid/protein molar ratio of 100/1. The heating (solid lines) and cooling curves (dotted lines) are shown for each sample. The linewidths corresponding to EmrE in the absence and presence of TPP+ show similar profiles when comparing heating or cooling curves, which is consistent with 16:0-PC data in Figure 1D. However, due to the observed thermal hysteresis for the lipid only POPE/POPG mixture, only qualitative conclusions can be drawn regarding the effect of TPP+ binding to EmrE on the phase transitions.
