Figure 4.
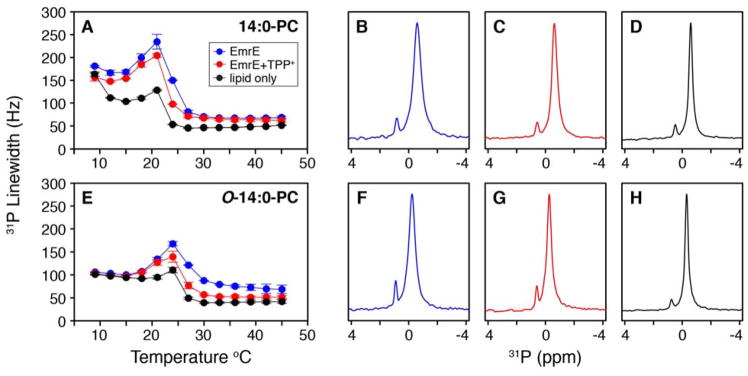
31P linewidths from a single pulse MAS experiment for EmrE embedded within 14:0-PC (A) and O-14:0-PC bilayers (E). The blue and red points correspond to EmrE in the absence and presence of TPP+, respectively. The black points correspond to the lipid only samples. Data reflect the average of two separate trials where the error bars represent the standard deviation of these datasets. The 31P linewidth vs. temperature plots for each trial are shown in Figure S3. Representative 31P spectra are shown at a temperature of 23 °C for 14:0-PC in the absence (B) and presence of TPP+ (C) and lipid only (D). The same is shown at 27 °C for O-14:0-PC in the absence (F) and presence of TPP+ (G) and lipid only (H). In both lipid compositions, there is a reduction in the 31P linewidth when EmrE is bound with TPP+. Note that the small peak around ~1 ppm is signal from the phosphate buffer used to prepare the samples.

