
Figure 3.
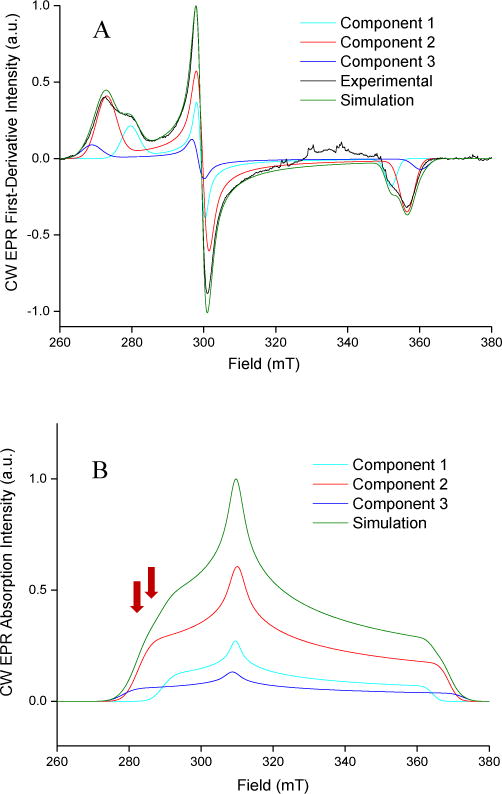
CW-EPR spectrum and simulations. (A) The CW-EPR spectrum of CYP2C9d with 124 TRZ. The spectrum was taken at a microwave power of 3.334 mW, a modulation amplitude of 10.0 G, and a modulation frequency of 100 kHz. The simulated components that represent different complexes in the sample are labeled as component 1, component 2, and component 3. (B) The frequency-shifted absorbance CW-EPR spectrum of CYP2C9d with 124 TRZ.