Figure 4.

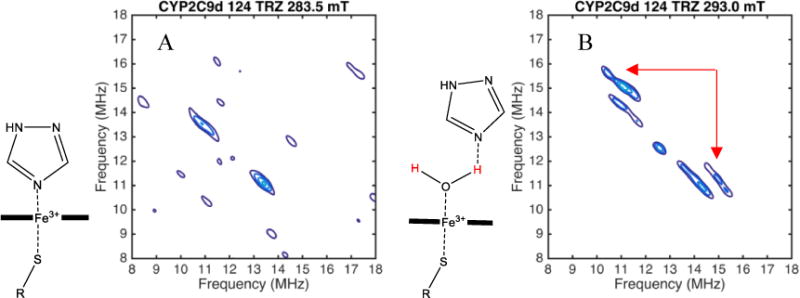
HYSCORE spectrum of CYP2C9d with 124 TRZ at 283.5 mT (A) and CYP2C9d with 124 TRZ at 293.0 mT (B). Peaks from the axial water in the spectrum at 293.0 mT are indicated with red arrows.

HYSCORE spectrum of CYP2C9d with 124 TRZ at 283.5 mT (A) and CYP2C9d with 124 TRZ at 293.0 mT (B). Peaks from the axial water in the spectrum at 293.0 mT are indicated with red arrows.