
FIGURE 1.
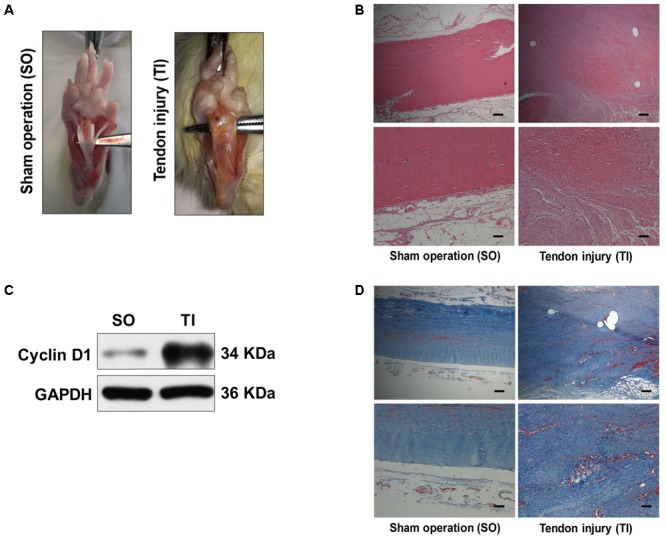
Peritendinous adhesion formation after tendon injury. (A) Representative images of macroscopic observation of deep flexor tendon of the plantar at 21 days after sham operation (SO) or tendon injury (TI). (B) Representative images of H&E staining of peritendinous tissues. Scale bar (upper): 250 μm. Scale bar (lower): 100 μm. (C) Representative images of western blot analysis of Cyclin D1 expression in SO and TI rats. (D) Representative images of masson staining of peritendinous tissues at 21 days after SO or TI rats. Scale bar (upper): 250 μm. Scale bar (lower): 100 μm. n = 5 in each group.