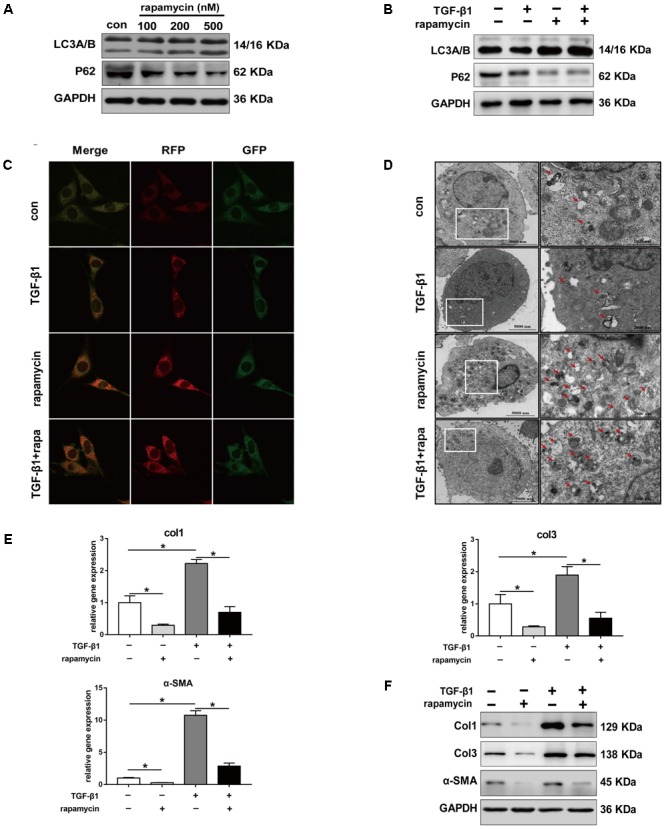
FIGURE 6.

Rapamycin regulates fibrotic gene expression in NIH/3T3 fibroblasts. (A) Representative images of western blot analysis of LC3A/B and p62 protein levels after different concentration of rapamycin treatment for 24 h. (B) Representative images of western blot of LC3A/B and p62 levels after TGF-β1 (2 ng/ml) and/or rapamycin (500 nM) treatment for 24 h. (C) Representative images of fibroblasts stably transfected with GFP-RFP-LC3 were treated with TGF-β1 and/or rapamycin. Images were obtained by confocal microscope. Green and red-positive puncta indicate autophagosomes; green-negative, red positive puncta indicate autophagolysosomes. (D) Representative images of fibroblasts were treated with TGF-β1 and/or rapamycin, then autophagic vesicles (AVs) were analyzed by transmission electron microscope. (E) mRNA and (F) protein levels of Col1, Col3, and α-SMA after treated with TGF-β1 and/or rapamycin. Data are shown as the mean ± SD of three independent experiments. ∗P < 0.05.
