
FIGURE 9.
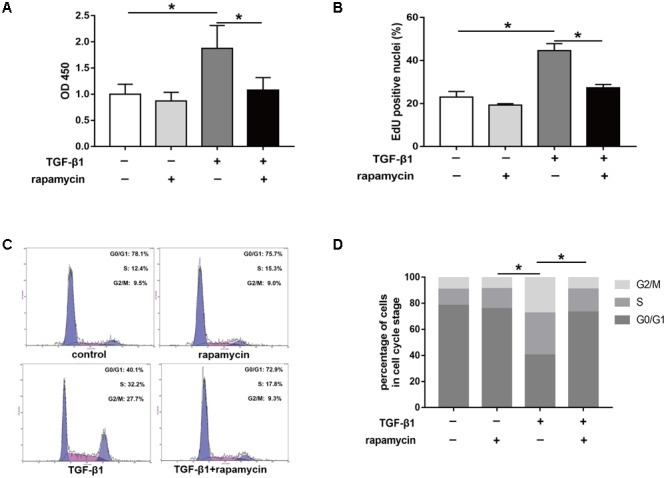
Rapamycin treatment suppresses tenocyte proliferation. (A) CCK8 analysis of cell viability after treated with TGF-β1 and/or rapamycin for 48 h. (B) Quantitative analysis of proliferative tenocytes by EdU staining after different treatments for 48 h. (C) Representative images of flow cytometry and (D) quantitative analysis of cell cycle distribution after different treatments for 48 h. Data are shown as the mean ± SD of three independent experiments. ∗P < 0.05.