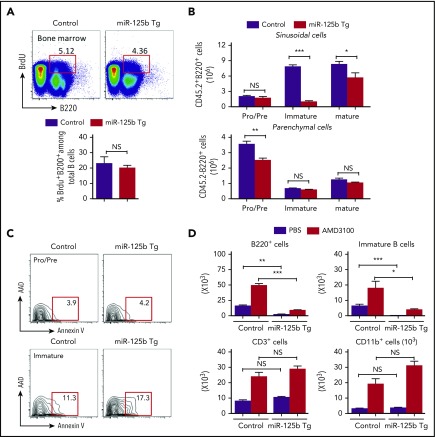
Figure 4.
Impaired release of immature B cells in Eμ/miR-125b-Tg mice. (A) Normal proliferation of bone marrow B cells in Eμ/miR-125b-Tg mice. 8-week-old Eμ/miR-125b-Tg and control mice were injected with BrdU for 48 hr. Bone marrow cells from these mice were stained with anti-B220 antibodies in combination with BrdU detection methodology. Percentages in the bar graph indicate BrdU-positive cells in the gated B200+ cell subpopulations. (B) Distribution and number of the indicated B-lineage populations in the bone marrow parenchyma (CD45.2−) and sinusoids (CD45.2+) of 8-week-old Eμ/miR-125b-Tg and control mice. (C) Representative flow cytometric analysis of bone marrow B cells for staining of apoptotic B cells using anti-annexin-V and 7-AAD. (D) Number of total B cells (B220+), immature B cells (B220+CD93+), T cells (CD3+), and myeloid cells (CD11b+) in 300 μL blood from Eμ/miR-125b-Tg and control mice that were injected with the AMD3100 or phosphate-buffered saline alone (n = 5 mice per group). *P < .05; **P < .01; ***P < .001; NS, not significant.

