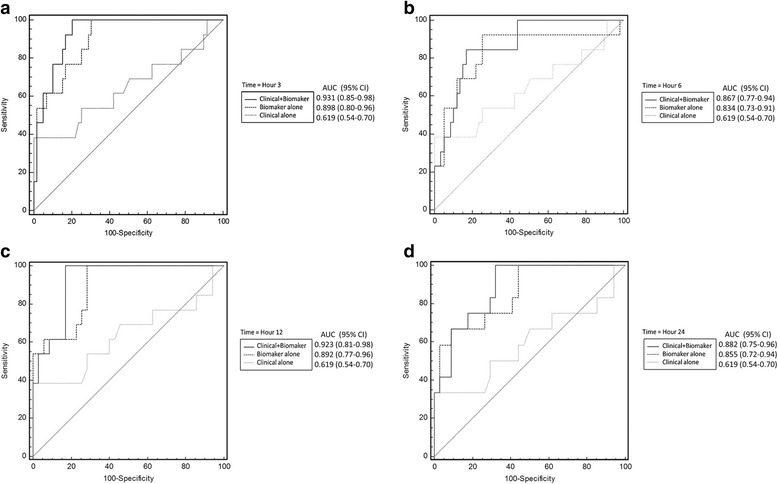
Fig. 2.

Receiver-operating characteristic (ROC) curves for the best prediction model for advanced acute kidney injury. The best biomarker panel combination alone (thick dashed line), clinical risk prediction model alone (thin dashed line) and combination of the clinical risk prediction model and combined biomarker panel (solid line) are shown at hour 3 (a), hour 6 (b), hour 12 (c) and hour 24 (d). The clinical risk prediction model is calculated from Liano’s score. The area under the ROC curve (AUC) values and 95% confidence intervals (CIs) are also shown
