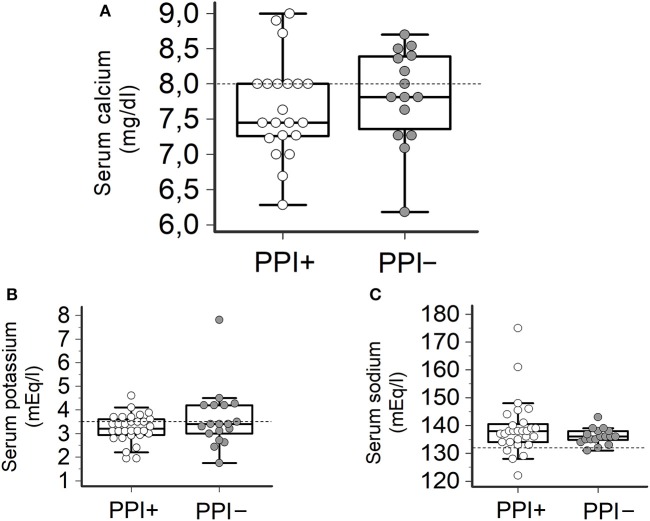
Figure 3.
Serum levels of calcium, potassium and sodium in TdP patients taking or not taking PPIs. (A) Serum calcium levels. Patients taking PPIs (PPI+), n = 20; patients not taking PPIs (PPI−), n = 17. Two-tail Student's unpaired t-test (p > 0.05). Horizontal dotted line indicates the lower limit of reference values for calcium levels, i.e., 8.0 mg/dl. (B) Serum potassium levels. PPI+, n = 27; PPI−, n = 18. Two-tail Student's unpaired t-test (p > 0.05). Horizontal dotted line indicates the lower limit of reference values for potassium levels, i.e., 3.5 mEq/L. (C) Serum sodium levels. PPI+, n = 28; PPI−, n = 20. Two-tail Student's unpaired t-test (p > 0.05). Horizontal dotted line indicates the lower limit of reference values for sodium levels, i.e., 132 mEq/L.

